The graph below shows the number of students enrolled in various courses at State University in spring 2000. Each bar
represents a different course, and the height of the bar represents the number of students enrolled. Use the graph to
answer the question. 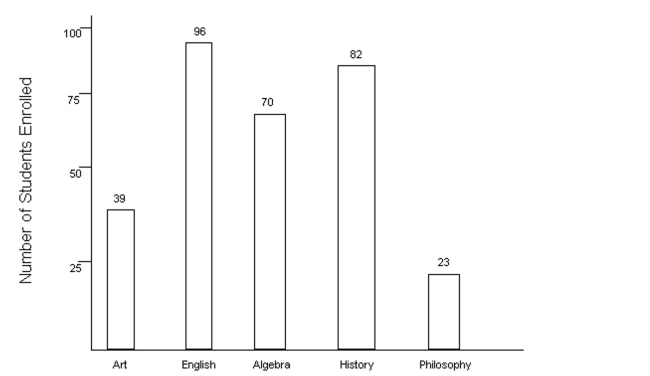
-Which course had the lowest enrollment?
A) Philosophy
B) Art
C) Algebra
D) English
Correct Answer:
Verified
Q77: Insert <, >, or = to
Q78: Some real numbers are integers.
Q79: Find the absolute value of the
Q80: Some rational numbers are irrational.
Q81: Insert <, >, or = to
Q83: Write the number as a product
Q84: Write the number as a product
Q85: Write the number as a product
Q86: Insert <, >, or = to
Q87: Write the fraction in lowest terms.
-
Unlock this Answer For Free Now!
View this answer and more for free by performing one of the following actions

Scan the QR code to install the App and get 2 free unlocks

Unlock quizzes for free by uploading documents