The circle graph below shows the number of pizzas consumed by college students in a typical month. Use the graph to
answer the question. 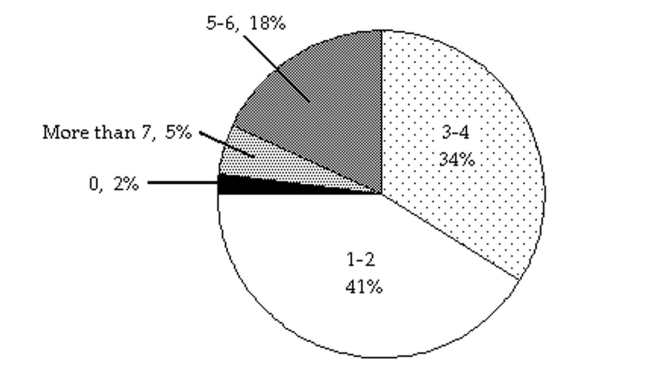
-If State University has approximately 29,000 students, about how many would you expect to consume 5-6 pizzas in a typical month?
A) 986 students
B) 9860 students
C) 522 students
D) 5220 students
Correct Answer:
Verified
Q321: Solve.
-The Discovery Museum is building a second
Q322: Solve.
-Melissa invested an amount of money in
Q323: Solve the inequality. Graph the solution
Q324: Solve the inequality. Graph the solution
Q325: Solve.
-The house numbers of two adjacent homes
Q327: Solve. Round to one decimal place
Q328: Solve the inequality. Graph the solution
Q329: Solve. Round to one decimal place
Q330: Solve.
-A number increased by three-fourths of
Q331: Solve.
-If two planes leave an airport at
Unlock this Answer For Free Now!
View this answer and more for free by performing one of the following actions

Scan the QR code to install the App and get 2 free unlocks

Unlock quizzes for free by uploading documents