Write the word or phrase that best completes each statement or answers the question.Solve.
-The table gives the number of cans of soda sold at a campus stand on five days with different high temperatures for the day. Write this data as a set of ordered pairs of the form (temperature, cans). Then create a scatter diagram of the data.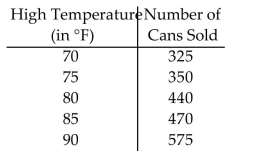
Correct Answer:
Verified
Q298: Graph.
-
Q299: Find an equation for the line.
Q300: Find an equation for the line.
Q301: The line graph shows the recorded
Q302: Determine whether the graph is the graph
Q304: Find the domain and range of
Q305: The bar graph shows the expenditures
Q306: Find the indicated function values.
-If
Q307: Find the domain and range of
Q308: The bar graph shows the expenditures
Unlock this Answer For Free Now!
View this answer and more for free by performing one of the following actions

Scan the QR code to install the App and get 2 free unlocks

Unlock quizzes for free by uploading documents