The figure shows the graphs of the cost and revenue functions for a company that manufactures and sells binoculars. Use
the information in the figure to answer the question. 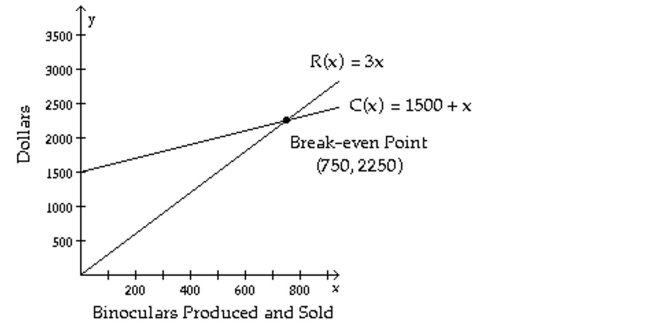
-What is the profit when 812 binoculars are produced?
A) $1748
B) $4748
C) $3124
D) $124
Correct Answer:
Verified
Q106: Solve.
-The manager of a bulk foods establishment
Q107: Fill in the blank with one
Q108: Given the cost function, C(x), and
Q109: Solve.
-Three trains - one eastbound, one westbound,
Q110: Solve.
-A store sells tents, sleeping bags, and
Q112: Solve.
-A chemist needs 120 milliliters of
Q113: Solve.
-A vendor sells hot dogs, bags of
Q114: Fill in the blank with one
Q115: Given the cost function, C(x), and
Q116: Given the cost function, C(x), and
Unlock this Answer For Free Now!
View this answer and more for free by performing one of the following actions

Scan the QR code to install the App and get 2 free unlocks

Unlock quizzes for free by uploading documents