The box plot shown below was constructed for the amount of soda that was poured by a filling machine into 12-ounce soda cans at a local soda bottling company. 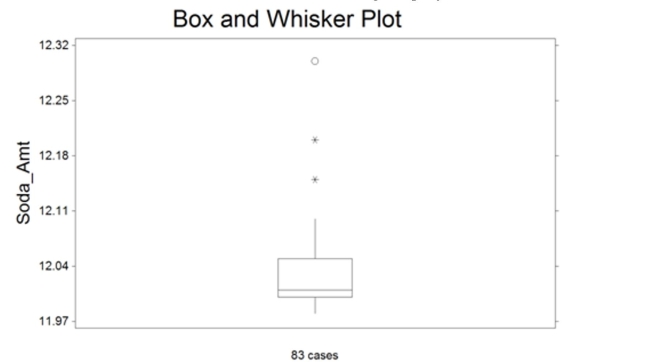 We see that one soda can received 12.30 ounces of soda on the plot above. Based on the box plot
Presented, how would you classify this observation?
A) suspect outlier
B) expected observation
C) it has a lot of soda
D) highly suspect outlier
Correct Answer:
Verified
Q171: Box plots are used to detect outliers
Q172: The data below represent the numbers
Q173: An outlier in a data set may
Q174: The box plot shown below displays the
Q175: The amount of television viewed by todayʹs
Q177: A sociologist recently conducted a survey
Q178: The following data represent the scores
Q179: A sample of professional golfers was taken
Q180: The outer fences of a box plot
Q181: Explain how it can be misleading to
Unlock this Answer For Free Now!
View this answer and more for free by performing one of the following actions

Scan the QR code to install the App and get 2 free unlocks

Unlock quizzes for free by uploading documents