A new chocolate company is estimating how many candy bars per week college students will consume of their line of
products. The graph shows the probable number of candy bars students (age 18 -22) will consume from year 0 to year 10.
B(x) gives the number of candy bars for boys, G(x) gives the number of candy bars for girls, and T(x) gives the total
number for both groups. Use the graph to answer the question. 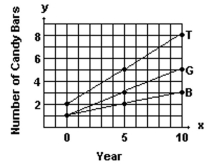
-Estimate B(4) and G(4) and use your estimates to estimate T(4) .
A) 2.0; 2.8; 4.8
B) 1.5; 2.5; 4.0
C) 1.8; 2.5; 4.3
D) 2.0; 3.0; 5.0
Correct Answer:
Verified
Q501: Determine whether (f ∘ g)(x) =
Q502: Consider the function h as defined.
Q503: Determine whether (f ∘ g)(x) =
Q504: Consider the function h as defined.
Q505: Consider the function h as defined.
Q507: For the given functions f and
Q508: Consider the function h as defined.
Q509: For the given functions f and
Q510: Determine whether (f ∘ g)(x) =
Q511: A new chocolate company is estimating how
Unlock this Answer For Free Now!
View this answer and more for free by performing one of the following actions

Scan the QR code to install the App and get 2 free unlocks

Unlock quizzes for free by uploading documents