Find the average rate of change illustrated in the graph.
-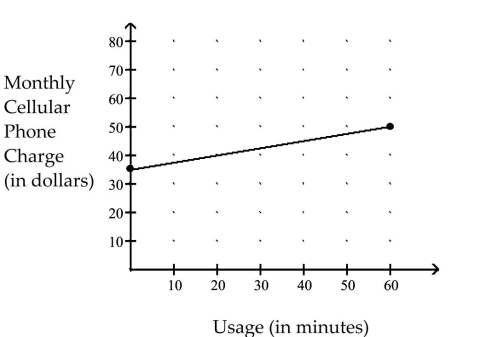
A) per minute
B) per minute
C) per minute
D) per minute
Correct Answer:
Verified
Q242: Solve the problem.
-From April through December,
Q243: Choose the value which could represent
Q244: Solve the problem.
-The rate of return of
Q245: Choose the value which could represent
Q246: Solve the problem.
-The linear function
Q248: Solve the problem.
-A school has just
Q249: Graph the line described.
-through
Q250: Solve the problem.
-A deep sea diving bell
Q251: Choose the value which could represent
Q252: Find the average rate of change
Unlock this Answer For Free Now!
View this answer and more for free by performing one of the following actions

Scan the QR code to install the App and get 2 free unlocks

Unlock quizzes for free by uploading documents