Construct a pie chart representing the given data set.
-The data below represent the results of a poll in which the the following question was asked: "To what degree are you satisfied with the outcome of the 2006 mayoral election?
Very
Somewhat
Not at All
No opinion 
A) 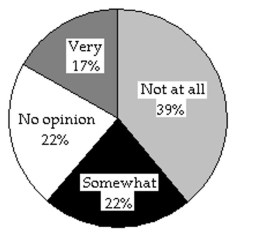
B) 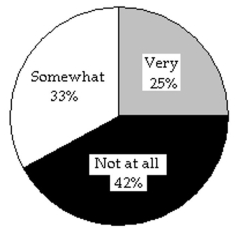
Correct Answer:
Verified
Q18: Determine which of the four levels of
Q82: Construct a stem-and-leaf diagram for the
Q83: A graphical display of a data set
Q84: Complete the contingency table and use
Q85: Classify the data as either qualitative
Q86: A variable whose values are observed by
Q89: Complete the contingency table and use
Q90: Construct a dotplot for the given
Q91: The temperature in Manhattan at 1 p.m.
Q92: A graphical display of a data set
Unlock this Answer For Free Now!
View this answer and more for free by performing one of the following actions

Scan the QR code to install the App and get 2 free unlocks

Unlock quizzes for free by uploading documents