Provide an appropriate response.
-The bar graph below shows the number of car accidents occurring in one city in each of the years 2001 through 2006. The vertical axis is truncated and as a result the graph is misleading. Construct an improved version of the graph which is less misleading. Use the symbol // in your graph. Explain what the symbol // means. 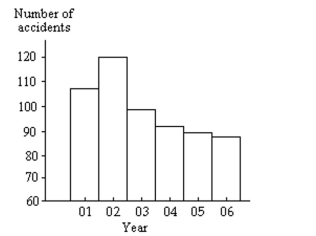
Correct Answer:
Verified
View Answer
Unlock this answer now
Get Access to more Verified Answers free of charge
Q3: Provide an appropriate response.
-Suppose you are comparing
Q22: Construct the requested histogram.
-During the quality
Q23: Use cutpoint grouping to organize these
Q24: A high school teacher keeps a record
Q25: Provide an appropriate response.
-A parcel delivery service
Q26: Construct the requested histogram.
-The table gives
Q28: Use limit grouping to organize these
Q29: Use cutpoint grouping to organize these
Q30: Shortly before a mayoral election, a
Q32: Hospital records show the age at death
Unlock this Answer For Free Now!
View this answer and more for free by performing one of the following actions

Scan the QR code to install the App and get 2 free unlocks

Unlock quizzes for free by uploading documents