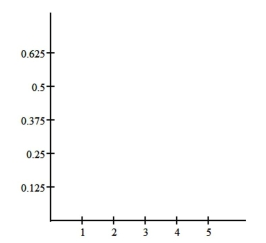
Construct the requested histogram.
-The table gives the frequency distribution for the data involving the number of radios per household for a sample of 80 U.S. households.

Correct Answer:
Verified
Q9: Given the following "data scenario," decide which
Q10: Maria constructed the frequency distribution shown
Q11: When organizing data into tables, what is
Q12: Which type of graph, a stem-and-leaf
Q13: Give an example of a data set
Q15: For a given data set, why might
Q16: A television manufacturer sold three times as
Q17: Use limit grouping to organize these
Q18: Provide an appropriate response.
-The preschool children
Q19: Given the following "data scenario," decide which
Unlock this Answer For Free Now!
View this answer and more for free by performing one of the following actions

Scan the QR code to install the App and get 2 free unlocks

Unlock quizzes for free by uploading documents