The following contingency table provides a joint frequency distribution for the popular votes cast in the presidential election by region and political party. Data are in thousands, rounded to the nearest thousand. 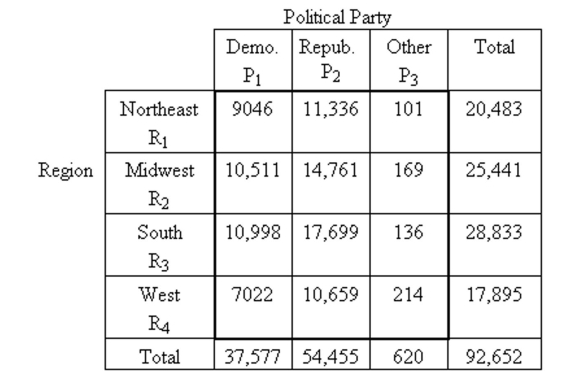 If a person who voted in the presidential election is selected at random, . Interpret this probability in terms of percentages.
Correct Answer:
Verified
View Answer
Unlock this answer now
Get Access to more Verified Answers free of charge
Q10: Provide an appropriate response.
-Discuss the differences, both
Q12: Provide an appropriate response.
-Describe an event whose
Q22: Find the indicated probability by using
Q24: Construct a Venn diagram representing the
Q27: Provide an appropriate response.
-Suppose a student is
Q27: Solve the problem.
-A poker hand consists of
Q28: Use the rule of total probability to
Q29: The age distribution of students at
Q30: Determine whether the events are independent.
-The
Q31:
Unlock this Answer For Free Now!
View this answer and more for free by performing one of the following actions

Scan the QR code to install the App and get 2 free unlocks

Unlock quizzes for free by uploading documents