A normal probability plot is given below for the lifetimes (in hours)of batteries of a particular type. Use the plot to identify outliers, if any. Explain your reasoning. 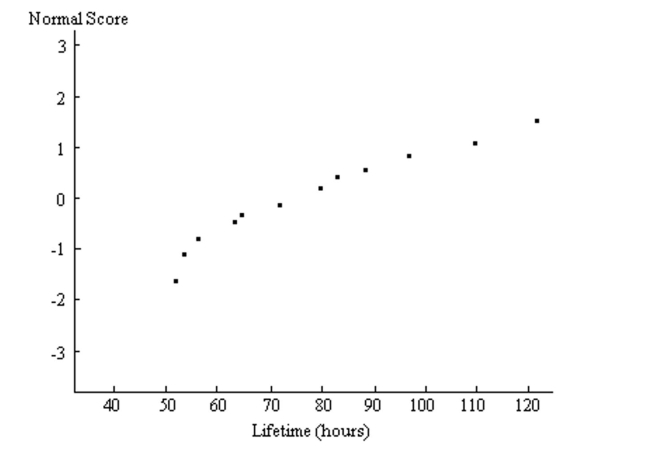
Correct Answer:
Verified
View Answer
Unlock this answer now
Get Access to more Verified Answers free of charge
Q37: Provide an appropriate response.
-Fill in the
Q38: Provide an appropriate response.
-Fill in the
Q39: A normal probability plot is given below
Q40: The area under the standard normal curve
Q41: Use the empirical rule to solve the
Q43: Suppose that scores on a test are
Q44: Provide an appropriate response. Assume that the
Q45: Use a table of areas for the
Q46: A normal probability plot is given below
Q47: Use a table of areas to find
Unlock this Answer For Free Now!
View this answer and more for free by performing one of the following actions

Scan the QR code to install the App and get 2 free unlocks

Unlock quizzes for free by uploading documents