A normal probability plot is given below for the lifetimes (in hours)of a sample of batteries of a particular brand. Use the plot to assess the normality of the lifetimes of these batteries. Explain your reasoning. 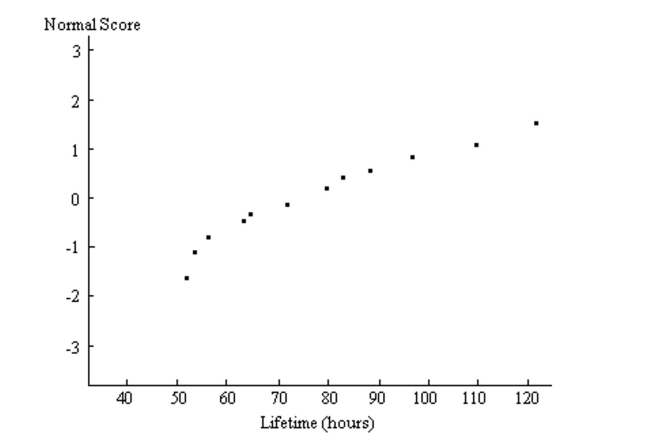
Correct Answer:
Verified
View Answer
Unlock this answer now
Get Access to more Verified Answers free of charge
Q16: Fill in the blanks. A fair
Q17: How does the standard normal distribution differ
Q18: Sketch a standard normal curve and shade
Q19: Generally, the normal probability plot for a
Q20: Two random variables are normally distributed with
Q22: Suppose that you know the area under
Q23: A variable is normally distributed. 42% of
Q24: Provide an appropriate response.
-In assessing the normality
Q25: A normal probability plot is given below
Q26: Suppose that you know the area under
Unlock this Answer For Free Now!
View this answer and more for free by performing one of the following actions

Scan the QR code to install the App and get 2 free unlocks

Unlock quizzes for free by uploading documents