A normal probability plot is given below for a sample of scores on an aptitude test. Use the plot to assess the normality of scores on this test. Explain your reasoning. 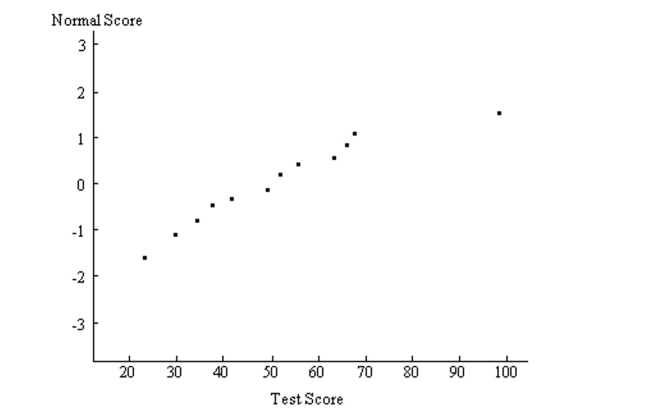
Correct Answer:
Verified
View Answer
Unlock this answer now
Get Access to more Verified Answers free of charge
Q29: Provide an appropriate response.
-Explain why a continuity
Q30: Sketch a standard normal curve and shade
Q31: Suppose that you know the area under
Q33: Construct a normal probability plot of
Q34: Construct a normal probability plot of
Q36: Provide an appropriate response.
-When a normal probability
Q37: Provide an appropriate response.
-Fill in the
Q38: Provide an appropriate response.
-Fill in the
Q39: A normal probability plot is given below
Q40: The area under the standard normal curve
Unlock this Answer For Free Now!
View this answer and more for free by performing one of the following actions

Scan the QR code to install the App and get 2 free unlocks

Unlock quizzes for free by uploading documents