A normal probability plot is given below for a sample of scores on an aptitude test. Use the plot to identify outliers, if any. Explain your reasoning. 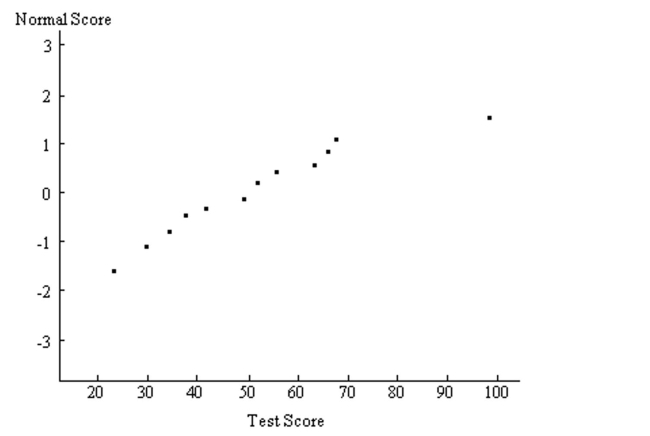
Correct Answer:
Verified
View Answer
Unlock this answer now
Get Access to more Verified Answers free of charge
Q8: Suppose that you know the area under
Q9: A student wished to use a table
Q10: Suppose that scores on a test are
Q11: Construct a normal probability plot of
Q12: According to data from the American Medical
Q14: In assessing the normality of data, why
Q15: Fill in the blanks. A fair
Q16: Fill in the blanks. A fair
Q17: How does the standard normal distribution differ
Q18: Sketch a standard normal curve and shade
Unlock this Answer For Free Now!
View this answer and more for free by performing one of the following actions

Scan the QR code to install the App and get 2 free unlocks

Unlock quizzes for free by uploading documents