Construct a pie chart representing the given data set.
- 
A) 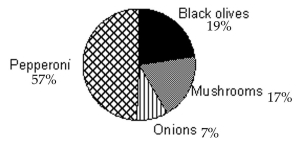
B) 
C) 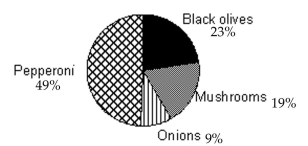
D) 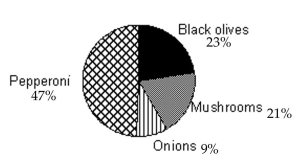
Correct Answer:
Verified
Q211: State whether you think that the variables
Q212: A sample statistic and margin of error
Q213: State whether the scatter diagram shows strong
Q214: Solve the problem.
-For the study described below,
Q215: Construct a line chart for the
Q217: Use the guidelines to evaluate the study.
Q218: Solve the problem.
-For the study described below,
Q219: Construct a pie chart representing the
Q220: Identify the variable as either qualitative
Q221: Use the guidelines to evaluate the study.
Unlock this Answer For Free Now!
View this answer and more for free by performing one of the following actions

Scan the QR code to install the App and get 2 free unlocks

Unlock quizzes for free by uploading documents