Make a scatter diagram for the data.
-The following table gives the total sales (revenue) and profits for 8 retailers. 
A) 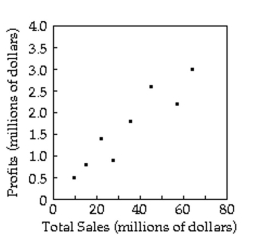
B) 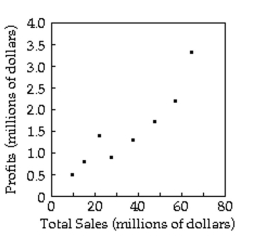
C) 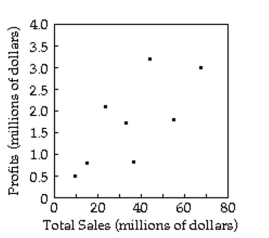
D) 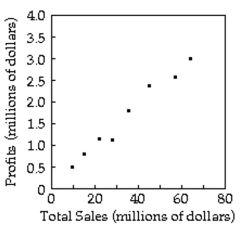
Correct Answer:
Verified
Q161: Construct a pie chart representing the
Q162: The stack plot below shows the value
Q163: A statement is made about correlation. State
Q164: Construct a pie chart representing the
Q165: A sample statistic and margin of error
Q167: Use the guidelines to evaluate the study.
Q168: Determine whether the study involves selection bias,
Q169: Identify which of these types of sampling
Q170: The stack plot below shows the value
Q171: Use the guidelines to evaluate the study.
Unlock this Answer For Free Now!
View this answer and more for free by performing one of the following actions

Scan the QR code to install the App and get 2 free unlocks

Unlock quizzes for free by uploading documents