The stack plot below shows the value of each of Danny's investments. The stack plot contains three regions. Theuppermost unshaded region represents the value of Danny's investment in individual stocks. The center shaded regionrepresents the value of Danny's investment in mutual funds and the bottom region in black represents the value ofDanny's investment in a CD. The thickness of a region at a particular time tells you its value at that time. 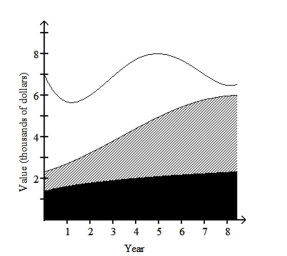 Use the graph to answer the question.
-In which year was the total value of Danny's investments the greatest?
A) year 5
B) year 0
C) year 4
D) year 8
Correct Answer:
Verified
Q151: State whether the scatter diagram shows strong
Q152: Construct a pie chart representing the
Q153: A statement is made about correlation. State
Q154: Use the graph to answer the question.
-
Q155: Determine whether the study involves selection bias,
Q157: Determine whether the study involves selection bias,
Q158: Solve the problem.
-For the study described below,
Q159: Construct a line chart for the
Q160: State whether you think that the variables
Q161: Construct a pie chart representing the
Unlock this Answer For Free Now!
View this answer and more for free by performing one of the following actions

Scan the QR code to install the App and get 2 free unlocks

Unlock quizzes for free by uploading documents