The stack plot below shows the value of each of Danny's investments. The stack plot contains three regions. Theuppermost unshaded region represents the value of Danny's investment in individual stocks. The center shaded regionrepresents the value of Danny's investment in mutual funds and the bottom region in black represents the value ofDanny's investment in a CD. The thickness of a region at a particular time tells you its value at that time. 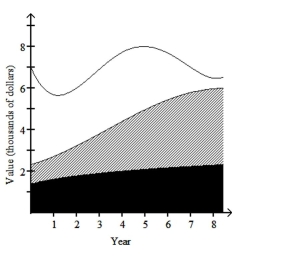 Use the graph to answer the question.
-In year 8, approximately what percentage of Danny's total investment was in mutual funds?
A) 60%
B) 50%
C) 80%
D) 70%
Correct Answer:
Verified
Q142: Identify the variable as either qualitative or
Q143: Solve the problem.
-For the study described below,
Q144: Answer the question.
-What name is given to
Q145: Answer the question.
-Which type of graphs can
Q146: Use the graph to answer the question.
-
Unlock this Answer For Free Now!
View this answer and more for free by performing one of the following actions

Scan the QR code to install the App and get 2 free unlocks

Unlock quizzes for free by uploading documents