Use the graph to answer the question.
-This double-bar graph shows the number of male (M) and female (F) athletes at a university over a four-year period. 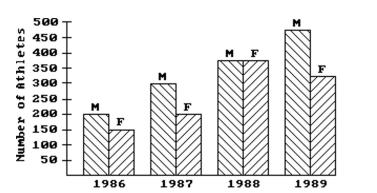 Compare the trend in the number of male athletes during the four-year period and the trend in the
Number of female athletes during the four-year period .
A) The number of male athletes and the number of female athletes increased steadily over the four-year period.
B) The number of male athletes increased steadily over the four-year period. The number of female athletes increased in 1987 then decreased again in 1988 and 1989.
C) The number of male athletes increased steadily over the four-year period. The number of female athletes increased to a peak in 1988 and then decreased again in 1989.
D) The number of female athletes increased steadily over the four-year period. The number of male athletes increased to a peak in 1988 and then decreased again in 1989.
Correct Answer:
Verified
Q84: Explain in your own words the difference
Q106: Use the guidelines to evaluate the study.
Q107: Make a bar graph to represent
Q108: Use the graph to answer the question.
-The
Q109: Create a graphical display for the
Q110: Provide an appropriate response.
-Suppose that you
Q112: State whether you think that the variables
Q113: Create a graphical display for the
Q115: Provide an appropriate response.
-Construct a frequency table
Q116: Provide an appropriate response.
-The ages of
Unlock this Answer For Free Now!
View this answer and more for free by performing one of the following actions

Scan the QR code to install the App and get 2 free unlocks

Unlock quizzes for free by uploading documents