Use the graph to answer the question.
-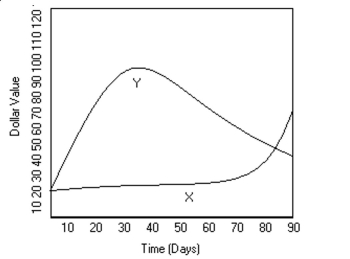 Mike decides to buy shares of companies X and Y, which were initially selling for the same
price. The changes in the value of each stock over a 90-day period are shown in the graph
above. Describe the trend in the value of each stock over the 90-day period.
Correct Answer:
Verified
View Answer
Unlock this answer now
Get Access to more Verified Answers free of charge
Q84: Explain in your own words the difference
Q115: Provide an appropriate response.
-Construct a frequency table
Q116: Provide an appropriate response.
-The ages of
Q117: Provide an appropriate response.
-Suppose that a
Q118: Make a bar graph to represent
Q120: Construct the specified histogram.
-In a
Q121: A statement is made about correlation. State
Q122: Identify the variable as either qualitative
Q123: Determine whether the study involves selection bias,
Q124: A sample statistic and margin of
Unlock this Answer For Free Now!
View this answer and more for free by performing one of the following actions

Scan the QR code to install the App and get 2 free unlocks

Unlock quizzes for free by uploading documents