Answer the question.
-The graph below shows estimated world population for the period 4000 BC Note that the logarithm of the world population and not actual population is plotted on
the vertical axis. This means, for example, that when the graph reaches 7 on the vertical
scale, world population is and when the graph reaches 9 on the vertical scale, world
population is . 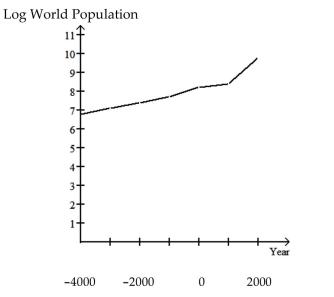 Why must the graph be interpreted with care? If the graph is not interpreted with care
what misleading impression might one have of world population during the period 4000
BC - 2000 AD? Why do you think that the graph was presented in this form?
Correct Answer:
Verified
View Answer
Unlock this answer now
Get Access to more Verified Answers free of charge
Q98: Use the guidelines to evaluate the study.
Q99: Use the indicated bin size to
Q100: Provide an appropriate response.
-Shortly before a
Q101: Solve the problem.
-A researcher finds a positive
Q102: Answer the question.
-The graph below shows the
Q104: Provide an appropriate response.
-Suppose that you
Q105: Make a bar graph to represent
Q106: Use the guidelines to evaluate the study.
Q107: Make a bar graph to represent
Q108: Use the graph to answer the question.
-The
Unlock this Answer For Free Now!
View this answer and more for free by performing one of the following actions

Scan the QR code to install the App and get 2 free unlocks

Unlock quizzes for free by uploading documents