The graph below shows the approximate annual percentage growth rate in world population for the years 1960 through
2010. Data is estimated by the UN Census Bureau. 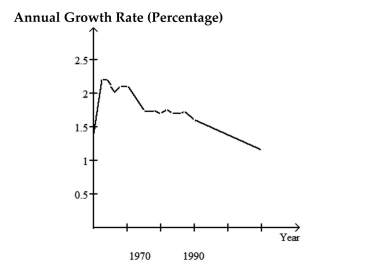 Use the graph to answer the question.
-Describe the trend in world population during the period 1990-2000
A) It decreases at a steady rate
B) It increases at a slower and slower rate
C) It decreases at a faster and faster rate
D) It increases at a steady rate
Correct Answer:
Verified
Q1: Answer the question.
-A researcher wishes to determine
Q2: Choose the best wording for the question
Q3: Answer the question.
-In a study to determine
Q4: In order to answer the given question,
Q5: The graph below shows the approximate annual
Q7: Answer as requested.
-Which of the following is
Q8: Answer the question.
-Double blinding is used in
Q9: Answer the question.
-Which of the following describes
Q10: Answer as requested.
-Which of the following is
Q11: Choose the best wording for the question
Unlock this Answer For Free Now!
View this answer and more for free by performing one of the following actions

Scan the QR code to install the App and get 2 free unlocks

Unlock quizzes for free by uploading documents