Provide an appropriate response.
-The following graph represents a function. Identify the independent and dependent variables and describe the domain and range. 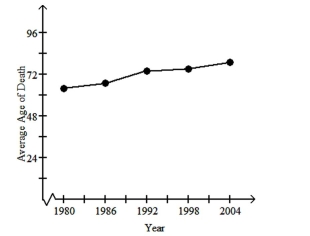
A) The independent variable is age and the dependent variable is time, measured in years. The domain is the ages between 0 and 79. The range is the years between 1980 and 2004.
B) The independent variable is time, measured in years, and the dependent variable is age. The domain is the years between 1980 and 2004. The range is the ages between 0 and 79.
C) The independent variable is age and the dependent variable is time, measured in years. The domain is the years between 1980 and 2004. The range is the ages between 0 and 79.
D) The independent variable is time, measured in years, and the dependent variable is age. The domain is the ages between 0 and 79. The range is the years between 1980 and 2004.
Correct Answer:
Verified
Q11: Briefly discuss the conditions under which a
Q12: Briefly discuss the conditions under which a
Q13: Plot and label the given points.
-
Q14: Plot and label the given points.
-
Q15: Briefly discuss the conditions under which a
Q17: For the given function:
a)Describe an appropriate domain
Q18: Write an equation for the linear
Q19: For the given function:
a)Describe an appropriate domain
Q20: Plot and label the given points.
-
Q21: Create the required linear function an
Unlock this Answer For Free Now!
View this answer and more for free by performing one of the following actions

Scan the QR code to install the App and get 2 free unlocks

Unlock quizzes for free by uploading documents