Solve the problem. Round your answers to the nearest whole percent.
-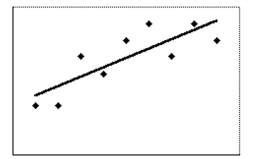
The scatter diagram shows the data for the prices of a stock (y) and U.S. employment (x) . The correlation coeffici . Determine how much of the variation in the stock price can be accounted for by the best-fit line.
A)
B)
C)
D) cient r is
Correct Answer:
Verified
Q31: To get the best deal on
Q32: Construct a scatter diagram with two groups
Q33: Select the best-fit line for the
Q34: Write possible coordinates for the single outlier
Q35: Select the best-fit line for the
Q37: Write possible coordinates for both outliers so
Q38: The table contains the weights (in
Q39: Construct a scatter diagram with several groups
Q40: Select the best-fit line for the
Q41: Determine whether the stated causal connection is
Unlock this Answer For Free Now!
View this answer and more for free by performing one of the following actions

Scan the QR code to install the App and get 2 free unlocks

Unlock quizzes for free by uploading documents