Use the graph to answer the question.
- Mike decides to buy shares of companies X and Y, which were initially selling for the same price. The changes in each stock's value over 90 days are shown in the graph above. When did the two
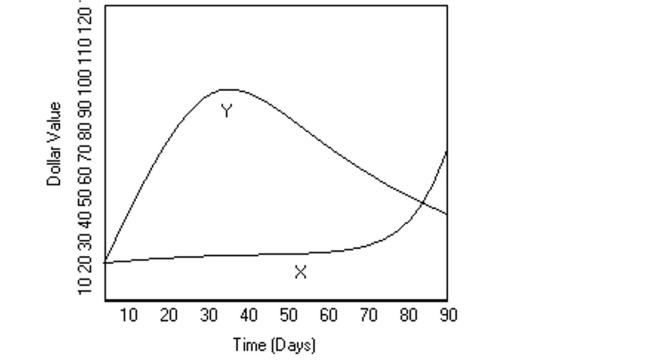
Stocks have the same value, other than when he bought them?
A) day 80
B) day 50
C) day 85
D) day 90
Correct Answer:
Verified
Q56: In a school survey, students showed these
Q57: This double-bar graph shows the number of
Q58: In a school survey, students showed these
Q59: This double-bar graph shows the number of
Q60: In a school survey, students showed these
Q62: Use the graph to answer the question.
-
Q63: Find the indicated probability.
-A relative frequency
Q64: Find the indicated probability.
-In a survey,
Q65: Find the indicated probability.
-The age distribution
Q66: Use the information to complete a
Unlock this Answer For Free Now!
View this answer and more for free by performing one of the following actions

Scan the QR code to install the App and get 2 free unlocks

Unlock quizzes for free by uploading documents