Use the graph to answer the question.
- Mike decides to buy shares of companies A, B, and C, which were initially selling for the same price. The changes in each stock's value are shown in the graph above. Knowing what he knows
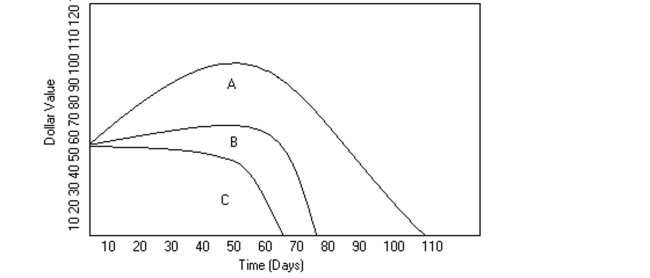
Now, after how many days should he have sold in his stock in company A?
A) 30
B) 50
C) 60
D) 80
Correct Answer:
Verified
Q63: Find the indicated probability.
-A relative frequency
Q64: Find the indicated probability.
-In a survey,
Q65: Find the indicated probability.
-The age distribution
Q66: Use the information to complete a
Q67: Find the indicated probability.
-The table shows the
Q69: Find the indicated probability.
-A relative frequency
Q70: Find the indicated probability.
-The table shows the
Q71: Use the graph to answer the question.
-
Q72: Use the graph to answer the question.
-
Q73: Solve the problem.
-Sixteen workers were surveyed
Unlock this Answer For Free Now!
View this answer and more for free by performing one of the following actions

Scan the QR code to install the App and get 2 free unlocks

Unlock quizzes for free by uploading documents