Use the graph to answer the question.
- Mike decides to buy shares of companies A, B, and C, which were initially selling for the same price. The changes in each stock's value are shown in the graph above. At its peak, stock A was
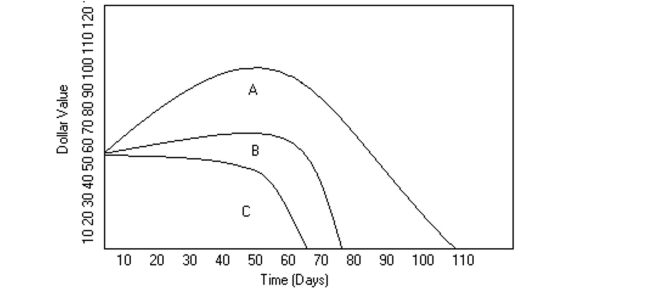
Valued at approximately how much more than either B or C?
A) $15
B) $30
C) $10
D) $35
Correct Answer:
Verified
Q71: Use the graph to answer the question.
-
Q72: Use the graph to answer the question.
-
Q73: Solve the problem.
-Sixteen workers were surveyed
Q74: Use the information to complete a
Q75: Find the indicated probability.
-The age distribution
Q77: Use the graph to answer the question.
-
Q78: Make a bar graph to represent
Q79: Use the graph to answer the question.
-
Q80: Use the information to complete a
Q81: Suppose that you want to construct
Unlock this Answer For Free Now!
View this answer and more for free by performing one of the following actions

Scan the QR code to install the App and get 2 free unlocks

Unlock quizzes for free by uploading documents