Answer the question based on the given graph.
-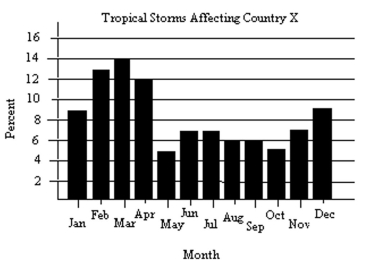
The data used to determine the graph were based on the number of tropical storms affecting Country X during the last ten years. A total of 672 tropical storms were reported. How many more tropical storms occurred during April than September? Round your answer to the nearest whole number, if necessary.
A) 54
B) 67
C) 13
D) 40
Correct Answer:
Verified
Q222: Solve the inequality, then graph the
Q223: Solve the inequality. Give the solution
Q224: Answer the question based on the
Q225: Solve the inequality, then graph the
Q226: Solve the inequality, then graph the
Q228: Solve the inequality, then graph the
Q229: Solve the inequality, then graph the
Q230: Answer the question based on the given
Q231: Answer the question based on the
Q232: Solve the problem.
-A salesperson has two job
Unlock this Answer For Free Now!
View this answer and more for free by performing one of the following actions

Scan the QR code to install the App and get 2 free unlocks

Unlock quizzes for free by uploading documents