Answer the question based on the given graph.
- The data used to determine the graph were based on the number of tropical storms affecting Country X during the last ten years. A total of 703 tropical storms were reported. In which months
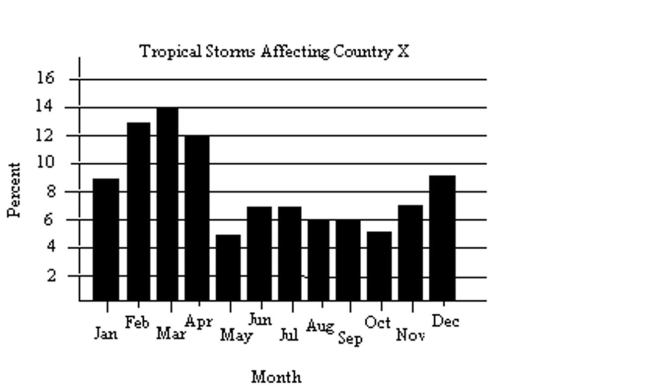
Were more than 84 storms reported?
A) February, March, April
B) March
C) February, March
D) January, February, March, April, December
Correct Answer:
Verified
Q232: Solve the problem.
-A salesperson has two job
Q233: Answer the question based on the given
Q234: Answer the question based on the
Q235: Solve the problem.
-A car rental company has
Q236: Solve the inequality, then graph the
Q238: Solve the problem.
-Company A rents copiers for
Q239: Solve the inequality, then graph the
Q240: Answer the question based on the
Q241: Evaluate the expression. Q242: Evaluate the expression.
-
-
Unlock this Answer For Free Now!
View this answer and more for free by performing one of the following actions

Scan the QR code to install the App and get 2 free unlocks

Unlock quizzes for free by uploading documents