Solve the problem.
-The number of births in County A has been increasing in recent years. Use the information given in the bar graph for the years 1960 and 1990, letting x = 0 represent the year 1960 and letting y represent the number of births. Use the graph to estimate the number of births in 1970. 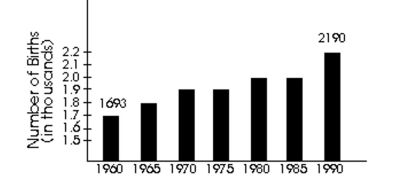
A) 1950
B) 1825
C) 1900
D) 1850
Correct Answer:
Verified
Q73: Decide whether the statement translates into an
Q74: Provide an appropriate response.
-
Q75: Decide whether the statement translates into an
Q76: Solve the problem.
-The number of births in
Q77: If one step in the solution of
Q79: Decide whether the statement translates into an
Q80: Provide an appropriate response.
-2x - 5 =
Q81: Let x represent the unknown, and write
Q82: Translate the verbal phrase into a mathematical
Q83: Solve the problem.
-If four times a number
Unlock this Answer For Free Now!
View this answer and more for free by performing one of the following actions

Scan the QR code to install the App and get 2 free unlocks

Unlock quizzes for free by uploading documents