On the right are two dotplots made for the heights of 200 randomly chosen students. The heights are separated by gender. Describe and compare the distributions 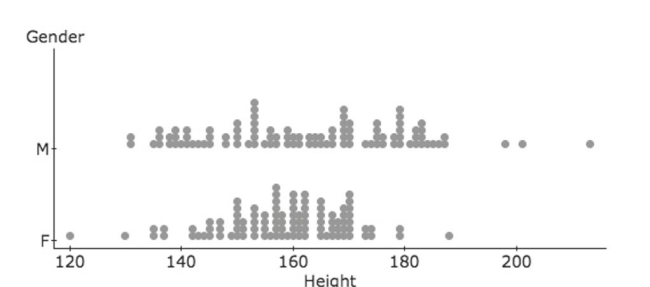
Correct Answer:
Verified
View Answer
Unlock this answer now
Get Access to more Verified Answers free of charge
Q1: The side-by-side boxplots show the cumulative college
Q2: The side-by-side boxplots show the cumulative college
Q3: At www.census.gov you can create a "population
Q5: One thousand students from a local university
Q6: The boxplots show prices of used cars
Q7: The side-by-side boxplots show the cumulative college
Q8: A few of the male students are
Q9: The side-by-side boxplots show the cumulative college
Q10: The following boxplots show monthly sales revenue
Q11: The following boxplots show monthly sales revenue
Unlock this Answer For Free Now!
View this answer and more for free by performing one of the following actions

Scan the QR code to install the App and get 2 free unlocks

Unlock quizzes for free by uploading documents