Use the statistical display to answer the question.
-The midterm test scores for the seventh-period typing class are shown below on a dot plot. 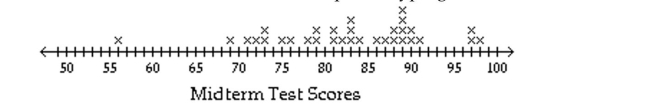 What are the outliers?
A) 86, 87, 88, 89, 90, 91
B) 56
C) 69
D) 97, 98
Correct Answer:
Verified
Q1: Use the statistical display to answer the
Q2: Use the figure to answer the
Q3: Use the statistical display to answer the
Q4: Construct the requested statistical display.
-The weights
Q6: Use the figure to answer the
Q7: Use the figure to answer the
Q8: Use the figure to answer the
Q9: Use the statistical display to answer the
Q10: Use the statistical display to answer the
Q11: Use the statistical display to answer the
Unlock this Answer For Free Now!
View this answer and more for free by performing one of the following actions

Scan the QR code to install the App and get 2 free unlocks

Unlock quizzes for free by uploading documents