The graph shows an idealized linear relationship for the average monthly payment to retirees from 1995 to 1999. Use the midpoint formula to estimate the average payment in 1997.
Average Monthly Payment to Retirees 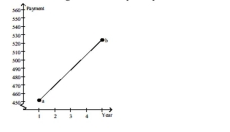
A) $36
B) $524
C) $488
D) $500
Correct Answer:
Verified
Q32: Graph the equation by determining the
Q33: The table shows enrollment in 2-year
Q34: Find the coordinates of the other endpoint
Q35: Graph the equation by plotting points.
-
Q36: Graph the equation by plotting points.
-
Q38: Find the coordinates of the other
Q39: Graph the equation by determining the
Q40: Determine whether the three points are
Q41: Provide an appropriate response.
-If the point
Q42: Graph the equation by plotting points.
-
Unlock this Answer For Free Now!
View this answer and more for free by performing one of the following actions

Scan the QR code to install the App and get 2 free unlocks

Unlock quizzes for free by uploading documents