The graph shows the region of feasible solutions. Find the maximum or minimum value, as specified, of the objective
function.
- 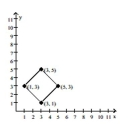
A) 0
B) 14
C) 18
D) 30
Correct Answer:
Verified
Q368: The graph shows the region of
Q369: Determine the system of inequalities illustrated
Q370: Solve the linear programming problem.
-Zach is planning
Q371: Solve the linear programming problem.
-An airline
Q372: Determine the system of inequalities illustrated
Q374: Use the shading capabilities of your
Q375: Solve the linear programming problem.
-A summer camp
Q376: Determine the system of inequalities illustrated
Q377: Determine the system of inequalities illustrated
Q378: Determine the system of inequalities illustrated
Unlock this Answer For Free Now!
View this answer and more for free by performing one of the following actions

Scan the QR code to install the App and get 2 free unlocks

Unlock quizzes for free by uploading documents