Suppose that the following model was fit to a set of data.
The corresponding plot if residuals against predicted values is shown. Interpret the plot.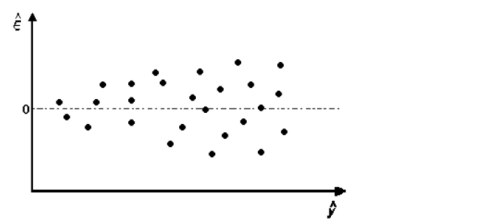
A) It appears that the variance of ? is not constant.
B) The residuals appear to be randomly scattered so that no model modifications are necessary.
C) It appears that the data contain an outlier.
D) It appears that a quadratic model would be a better fit.
Correct Answer:
Verified
Q112: For any given model fit to a
Q114: The stepwise regression procedure may not be
Q116: The staff of a test kitchen
Q117: A public health researcher wants to
Q120: The stepwise regression model should not be
Q122: The model Q123: The number of levels of observed x-values Q123: The model Q124: In the presence of multicollinearity, the Q125: The model Unlock this Answer For Free Now! View this answer and more for free by performing one of the following actions Scan the QR code to install the App and get 2 free unlocks Unlock quizzes for free by uploading documents

