Given below is the scatter plot of the number of employees and the total revenue
($millions) of 20 U.S. companies. Companies that have higher numbers of employees appear to
also have higher total revenue. 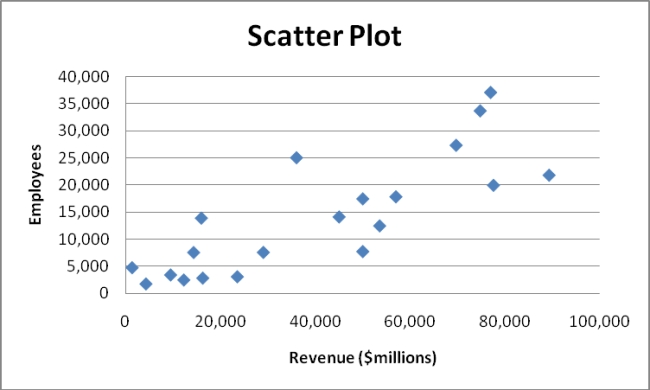
Correct Answer:
Verified
Q163: The Guidelines for Developing Visualizations recommend avoiding
Q169: The Guidelines for Developing Visualizations recommend using
Q170: The addition of visual elements that either
Q181: A multidimensional contingency table allows you to
Q184: When you work with many variables,you must
Q185: A multidimensional contingency table allows you to
Q211: SCENARIO 2-19-A
You are the quality control
Q215: SCENARIO 2-19-A
You are the quality control
Q217: SCENARIO 2-19-A
You are the quality control
Q218: SCENARIO 2-19-A
You are the quality control
Unlock this Answer For Free Now!
View this answer and more for free by performing one of the following actions

Scan the QR code to install the App and get 2 free unlocks

Unlock quizzes for free by uploading documents