Given below is the scatter plot of the number of employees and the total revenue
($millions) of 20 U.S. companies. There appears to be a positive relationship between total
revenue and the number of employees. 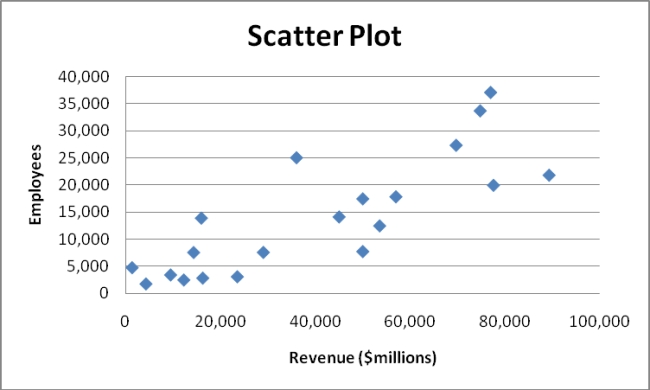
Correct Answer:
Verified
Q179: The Guidelines for Developing Visualizations recommend labeling
Q180: The Guidelines for Developing Visualizations recommend using
Q181: SCENARIO 2-15 The figure below is the
Q181: A multidimensional contingency table allows you to
Q182: SCENARIO 2-16 The figure below is the
Q182: The Guidelines for Developing Visualizations recommend always
Q183: The Guidelines for Developing Visualizations recommend always
Q202: SCENARIO 2-19-A
You are the quality control
Q203: SCENARIO 2-19-A
You are the quality control
Q205: SCENARIO 2-19-A
You are the quality control
Unlock this Answer For Free Now!
View this answer and more for free by performing one of the following actions

Scan the QR code to install the App and get 2 free unlocks

Unlock quizzes for free by uploading documents