Given below is the scatter plot of the market value (thousands$) and profit
(thousands$) of 50 U.S. companies. There appears to be a negative relationship between market
value and profit. 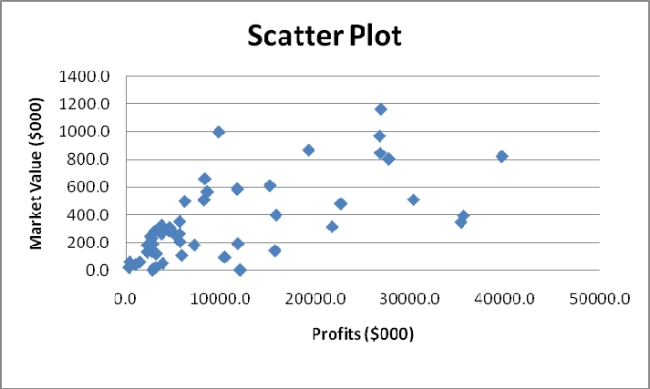
Correct Answer:
Verified
Q146: SCENARIO 2-17
The following table presents total retail
Q162: SCENARIO 2-18
The stem-and-leaf display below shows the
Q165: SCENARIO 2-17
The following table presents total retail
Q167: SCENARIO 2-18
The stem-and-leaf display below shows the
Q168: SCENARIO 2-18
The stem-and-leaf display below shows the
Q171: SCENARIO 2-18
The stem-and-leaf display below shows the
Q174: SCENARIO 2-18
The stem-and-leaf display below shows the
Q184: SCENARIO 2-16 The figure below is the
Q189: Given below is the scatter plot of
Q198: SCENARIO 2-16
The figure below is the percentage
Unlock this Answer For Free Now!
View this answer and more for free by performing one of the following actions

Scan the QR code to install the App and get 2 free unlocks

Unlock quizzes for free by uploading documents