Given below is the scatter plot of the price/earnings ratio versus earnings per
share of 20 U.S. companies. There appears to be a negative relationship between price/earnings
ratio and earnings per share. 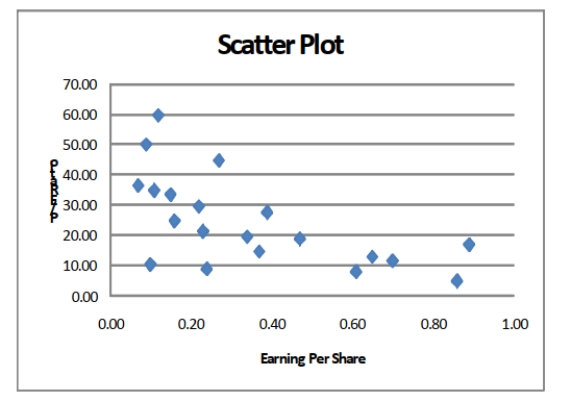
Correct Answer:
Verified
Q145: SCENARIO 2-14
The table below contains the
Q147: SCENARIO 2-17
The following table presents total retail
Q151: SCENARIO 2-17
The following table presents total retail
Q152: SCENARIO 2-14
The table below contains the
Q153: SCENARIO 2-14
The table below contains the
Q155: SCENARIO 2-15
The figure below is the ogive
Q170: SCENARIO 2-18
The stem-and-leaf display below shows the
Q176: SCENARIO 2-18
The stem-and-leaf display below shows the
Q178: SCENARIO 2-18
The stem-and-leaf display below shows the
Q184: Given below is the scatter plot of
Unlock this Answer For Free Now!
View this answer and more for free by performing one of the following actions

Scan the QR code to install the App and get 2 free unlocks

Unlock quizzes for free by uploading documents