Determine the maximum possible number of turning points for the graph of the function.
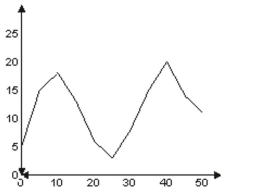
-Suppose that a polynomial function is used to model the data shown in the graph below. 
For what intervals is the function decreasing?
A) 10 through 25 and 40 through 50
B) 10 through 50
C) 10 through 25 and 40 through 45
D) 0 through 10 and 25 through 40
Correct Answer:
Verified
Q201: Determine the maximum possible number of
Q202: Use the Intermediate Value Theorem to
Q203: Determine the maximum possible number of
Q204: Use the Intermediate Value Theorem to
Q205: Use the Intermediate Value Theorem to
Q207: Determine the maximum possible number of turning
Q208: Determine the maximum possible number of
Q209: Determine the maximum possible number of
Q210: Determine the maximum possible number of turning
Q211: Find the zeros for the polynomial
Unlock this Answer For Free Now!
View this answer and more for free by performing one of the following actions

Scan the QR code to install the App and get 2 free unlocks

Unlock quizzes for free by uploading documents