Determine the maximum possible number of turning points for the graph of the function.
-Suppose that a polynomial function is used to model the data shown in the graph below. For what intervals is the function increasing?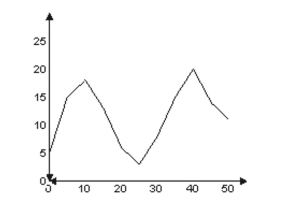
A) 0 through 10 and 25 through 40
B) 0 through 40
C) 0 through 10 and 20 through 50
D) 10 through 25 and 40 through 50
Correct Answer:
Verified
Q213: Determine the maximum possible number of
Q214: Determine the maximum possible number of turning
Q215: Determine the maximum possible number of
Q216: Find the zeros for the polynomial
Q217: Determine the maximum possible number of
Q219: Use the Intermediate Value Theorem to
Q220: Determine the maximum possible number of
Q221: Graph the polynomial function.
-
Q222: Determine the maximum possible number of
Q223: Graph the polynomial function.
-
Unlock this Answer For Free Now!
View this answer and more for free by performing one of the following actions

Scan the QR code to install the App and get 2 free unlocks

Unlock quizzes for free by uploading documents