Use the Leading Coefficient Test to determine the end behavior of the polynomial function. Then use this end
-The following table shows the number of DWI arrests in a county for the years , where 1 represents 1994, 2 represents 1995, and so on.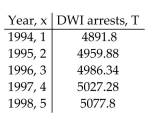
This data can be approximated using the third-degree polynomial
Use the Leading Coefficient Test to determine the end behavior to the right for the graph of T. Will this function be useful in modeling the number of DWI arrests over an extended period of time? Explain your answer.
A) The graph of T decreases without bound to the right. This means that as increases, the values of will become more and more negative and the function will no longer model the number of DWI arrests.
B) The graph of increases without bound to the right. This means that as increases, the values of will become large and positive and, since the values of T will become so large, the function will no longer model the number of DWI arrests.
C) The graph of approaches zero for large values of . This means that will not be useful in modeling the number of DWI arrests over an extended period.
D) The graph of T decreases without bound to the right. Since the number of larceny thefts will eventually decrease, the function T will be useful in modeling the number of DWI arrests over an extended period of time.
Correct Answer:
Verified
Q189: Find the zeros for the polynomial
Q190: Find the zeros of the polynomial
Q191: Find the zeros for the polynomial
Q192: Find the zeros of the polynomial
Q193: Use the Leading Coefficient Test to
Q195: Use the Leading Coefficient Test to
Q196: Find the zeros for the polynomial
Q197: Find the zeros for the polynomial
Q198: Find the zeros for the polynomial
Q199: Find the zeros for the polynomial
Unlock this Answer For Free Now!
View this answer and more for free by performing one of the following actions

Scan the QR code to install the App and get 2 free unlocks

Unlock quizzes for free by uploading documents