Solve the problem.
-The following data represents the normal monthly precipitation for a certain city.
\begin{tabular} { l | c } 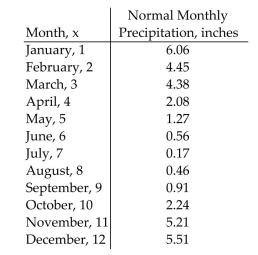
Draw a scatter diagram of the data for one period. Find a sinusoidal function of the form that fits the data. Draw the sinusoidal function on the scatter diagram. Use a graphing utility to find the sinusoidal function of best fit. Draw the sinusoidal function of best fit on the scatter diagram.
Correct Answer:
Verified
Q259: Graph the function. Q260: Use a vertical shift to graph Q261: Graph the function. Q262: Find an equation for the graph. Q263: Graph the function. Q265: Solve the problem. Q266: Solve the problem. Q267: Graph the function. Q268: Find an equation for the graph. Q269: Find an equation for the graph. Unlock this Answer For Free Now! View this answer and more for free by performing one of the following actions Scan the QR code to install the App and get 2 free unlocks Unlock quizzes for free by uploading documents
-
-
-
-
-The following data represents
-Suppose that the average
-
-
-

