Solve the problem.
-The data below represent the average monthly cost of natural gas in an Oregon home. 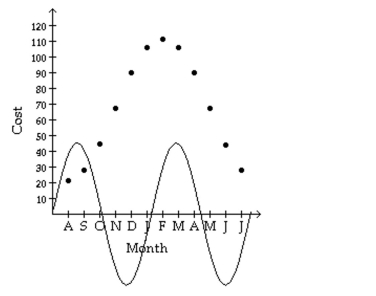 Above is the graph of superimposed over a scatter diagram of the data. Find the sinusoidal function o form which best fits the data.
A)
B)
C)
D)
Correct Answer:
Verified
Q339: Find the phase shift of the
Q340: Find the phase shift of the
Q341: Write the word or phrase that
Q342: Write the equation of a sine
Q343: Write the word or phrase that
Q345: Write the equation of a sine
Q346: Solve the problem.
-The number of hours
Q347: Solve the problem.
-For the equation
Q348: Write the equation of a sine
Q349: Write the equation of a sine
Unlock this Answer For Free Now!
View this answer and more for free by performing one of the following actions

Scan the QR code to install the App and get 2 free unlocks

Unlock quizzes for free by uploading documents