Data has been collected and a normal probability plot for one of the variables is shown below. Based on your knowledge of normal probability plots, do you believe the variable in question is normally distributed? The data are represented by the"o" symbols in the plot. 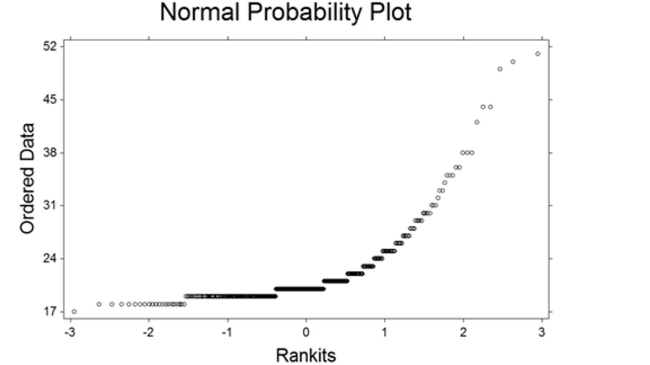
A) Yes. The plot reveals a straight line and this indicates the variable is normally distributed.
B) Yes. The plot reveals a curve and this indicates the variable is normally distributed.
C) No. The plot does not reveal a straight line and this indicates the variable is not normally distributed.
Correct Answer:
Verified
Q2: A recent article in the paper
Q3: A study of college students stated
Q4: Which of the following statements is
Q5: The time between arrivals at an
Q6: Which one of the following suggests
Q8: A recent study suggested that 70% of
Q9: Suppose a man has ordered twelve
Q10: A paint machine dispenses dye into paint
Q11: A discrete random variable
Q12: For a standard normal random variable,
Unlock this Answer For Free Now!
View this answer and more for free by performing one of the following actions

Scan the QR code to install the App and get 2 free unlocks

Unlock quizzes for free by uploading documents