The line graph shows the recorded hourly temperatures in degrees Fahrenheit at an airport. 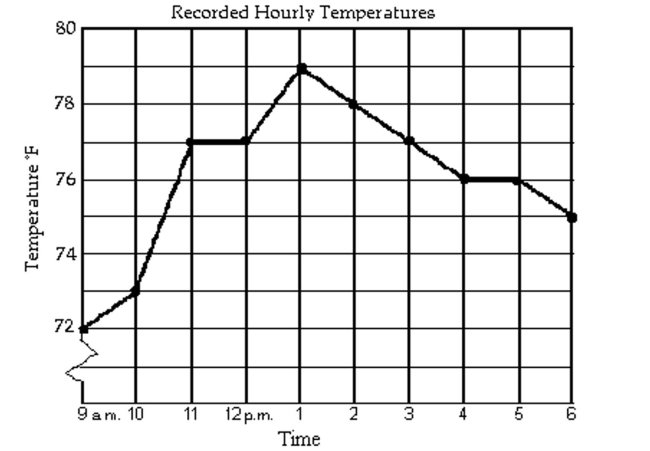
-At what times was the temperature higher than 77°F? 197)
A) from 12 p.m. until 3 p.m.
B) from 11 a.m. until 3 p.m.
C) from 12 p.m. until 1 p.m.
D) after 12 p.m.
Correct Answer:
Verified
Q176: Determine the largest open intervals of
Q177: The graph of y = f(x) is
Q178: Determine the largest open intervals of
Q179: The graph of y = f(x) is
Q180: Determine the largest open intervals of
Q182: Match the description with the correct symbolic
Q183: Match the description with the correct symbolic
Q184: Match the description with the correct
Q185: shown in the graph below. How
Q186: shown in the graph below. How
Unlock this Answer For Free Now!
View this answer and more for free by performing one of the following actions

Scan the QR code to install the App and get 2 free unlocks

Unlock quizzes for free by uploading documents