The following graph shows the populations of the metropolitan areas of City X and City Y over six years. 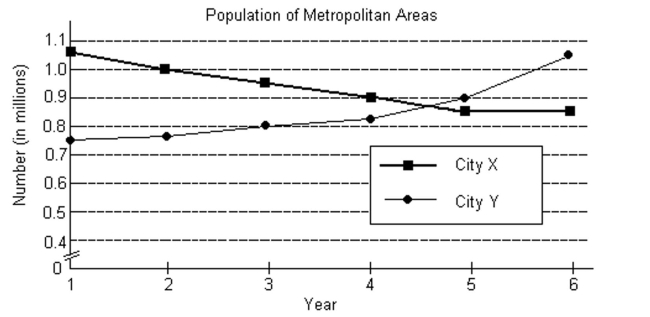
-Use the terms increasing, decreasing, and/or constant to describe the trends for the population of the City X metropolitan area.
A) The population of the City X metropolitan area was increasing from Year 1 to Year 5 and was constant from Year 5 to Year 6.
B) The population of the City X metropolitan area was decreasing from Year 1 to Year 6.
C) The population of the City X metropolitan area was increasing from Year 1 to Year 6.
D) The population of the City X metropolitan area was decreasing from Year 1 to Year 5 and was constant from Year 5 to Year 6.
Correct Answer:
Verified
Q15: Solve the system by substitution.
-
Q16: Solve the system by elimination.
-
Q17: The following graph shows the populations of
Q18: Solve the system by elimination.
-
Q19: The following graph shows the populations of
Q21: Use a graphing calculator to Express
Q22: Use a graphing calculator to Express
Q23: If the system has infinitely many
Q24: If the system has infinitely many
Q25: If the system has infinitely many
Unlock this Answer For Free Now!
View this answer and more for free by performing one of the following actions

Scan the QR code to install the App and get 2 free unlocks

Unlock quizzes for free by uploading documents