Crafty Bill's Cool Car Sales opened as a used car sales lot in 2006. The graph shows the number of cars sold f as a function of time t. Find and interpret f(2010) . 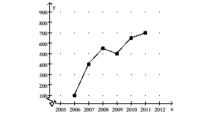
A) 450; Crafty Bill's Cool Car Sales sold 450 cars in 2010.
B) 600; Crafty Bill's Cool Car Sales sold 600 cars in 2010.
C) 600; Crafty Bill's Cool Car Sales sold 600 cars in 2006.
D) 650; Crafty Bill's Cool Car Sales sold 650 cars in 2010.
Correct Answer:
Verified
Q103: Graph the function with a graphing
Q104: Graph the function with a graphing
Q105: Graph the function with a graphing
Q106: Provide an appropriate response.
-Consider the linear
Q107: Provide an appropriate response.
-Give a definition of
Q109: Graph the function with a graphing
Q110: Provide an appropriate response.
-Suppose the population of
Unlock this Answer For Free Now!
View this answer and more for free by performing one of the following actions

Scan the QR code to install the App and get 2 free unlocks

Unlock quizzes for free by uploading documents