The bar graph below gives the number of births in a certain state for the months October to April, where corresponds to October and corresponds to April. If the number of births in thousands in this state is the function , where is in months, find and explain its meaning.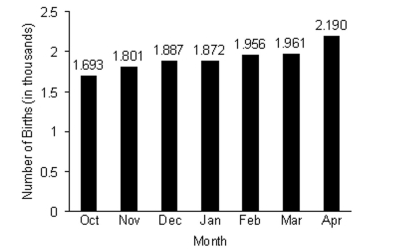
A) 1.887; In December, there were 1887 births in this state.
B) 1.872; In January, there were 1.872 births in this state.
C) 1.872; In January, there were 1872 births in this state.
D) 1.956; In February, there were 1956 births in this state.
Correct Answer:
Verified
Q110: Provide an appropriate response.
-Suppose the population of
Q111: The function Q112: Graph the function with a graphing Q113: Employees of a publishing company received an Q114: Graph the function with a graphing Q116: Graph the function with a graphing Q117: Suppose a cost-benefit model is given Q118: Graph the function with a graphing Q119: Crafty Bill's Cool Car Sales opened as Q120: Provide an appropriate response.
-Describe the graph
Unlock this Answer For Free Now!
View this answer and more for free by performing one of the following actions

Scan the QR code to install the App and get 2 free unlocks

Unlock quizzes for free by uploading documents